![[background image] image of area map (for a bars & pub)](https://cdn.prod.website-files.com/690a103420c462c71c28328d/69150350f700d0804c304bd8_gen2hero.png)

From rent burden to vacancy, we track how housing costs are reshaping who can afford to live where. Using proprietary datasets, our research reveals which neighborhoods are under pressure, where displacement is accelerating, and what interventions might actually work.
We make this data free and accessible to everyone to empower communities.


Coastal cities face unprecedented flooding, heat, and storm surge risks, but not all neighborhoods face equal exposure. By analyzing climate vulnerability through the lens of housing, infrastructure, and capital investment patterns, we make stochastic futures understandable.
![[background image] image of company location map (for a construction company)](https://cdn.prod.website-files.com/690a103420c462c71c28328d/69175627c438fdc7bbd13588_img8.png)

We analyze labor markets, commute patterns, wage gaps, and economic opportunity at the neighborhood scale. Our research connects employment data to economic mobility and spending patterns.

We map how health care access, food access, environmental hazards, and socio-economic conditions shape community well-being. From overdose clusters to maternal health disparities, our research identifies where public health interventions are most urgently needed.
Discover some of our latest work on housing, transportation, and more.

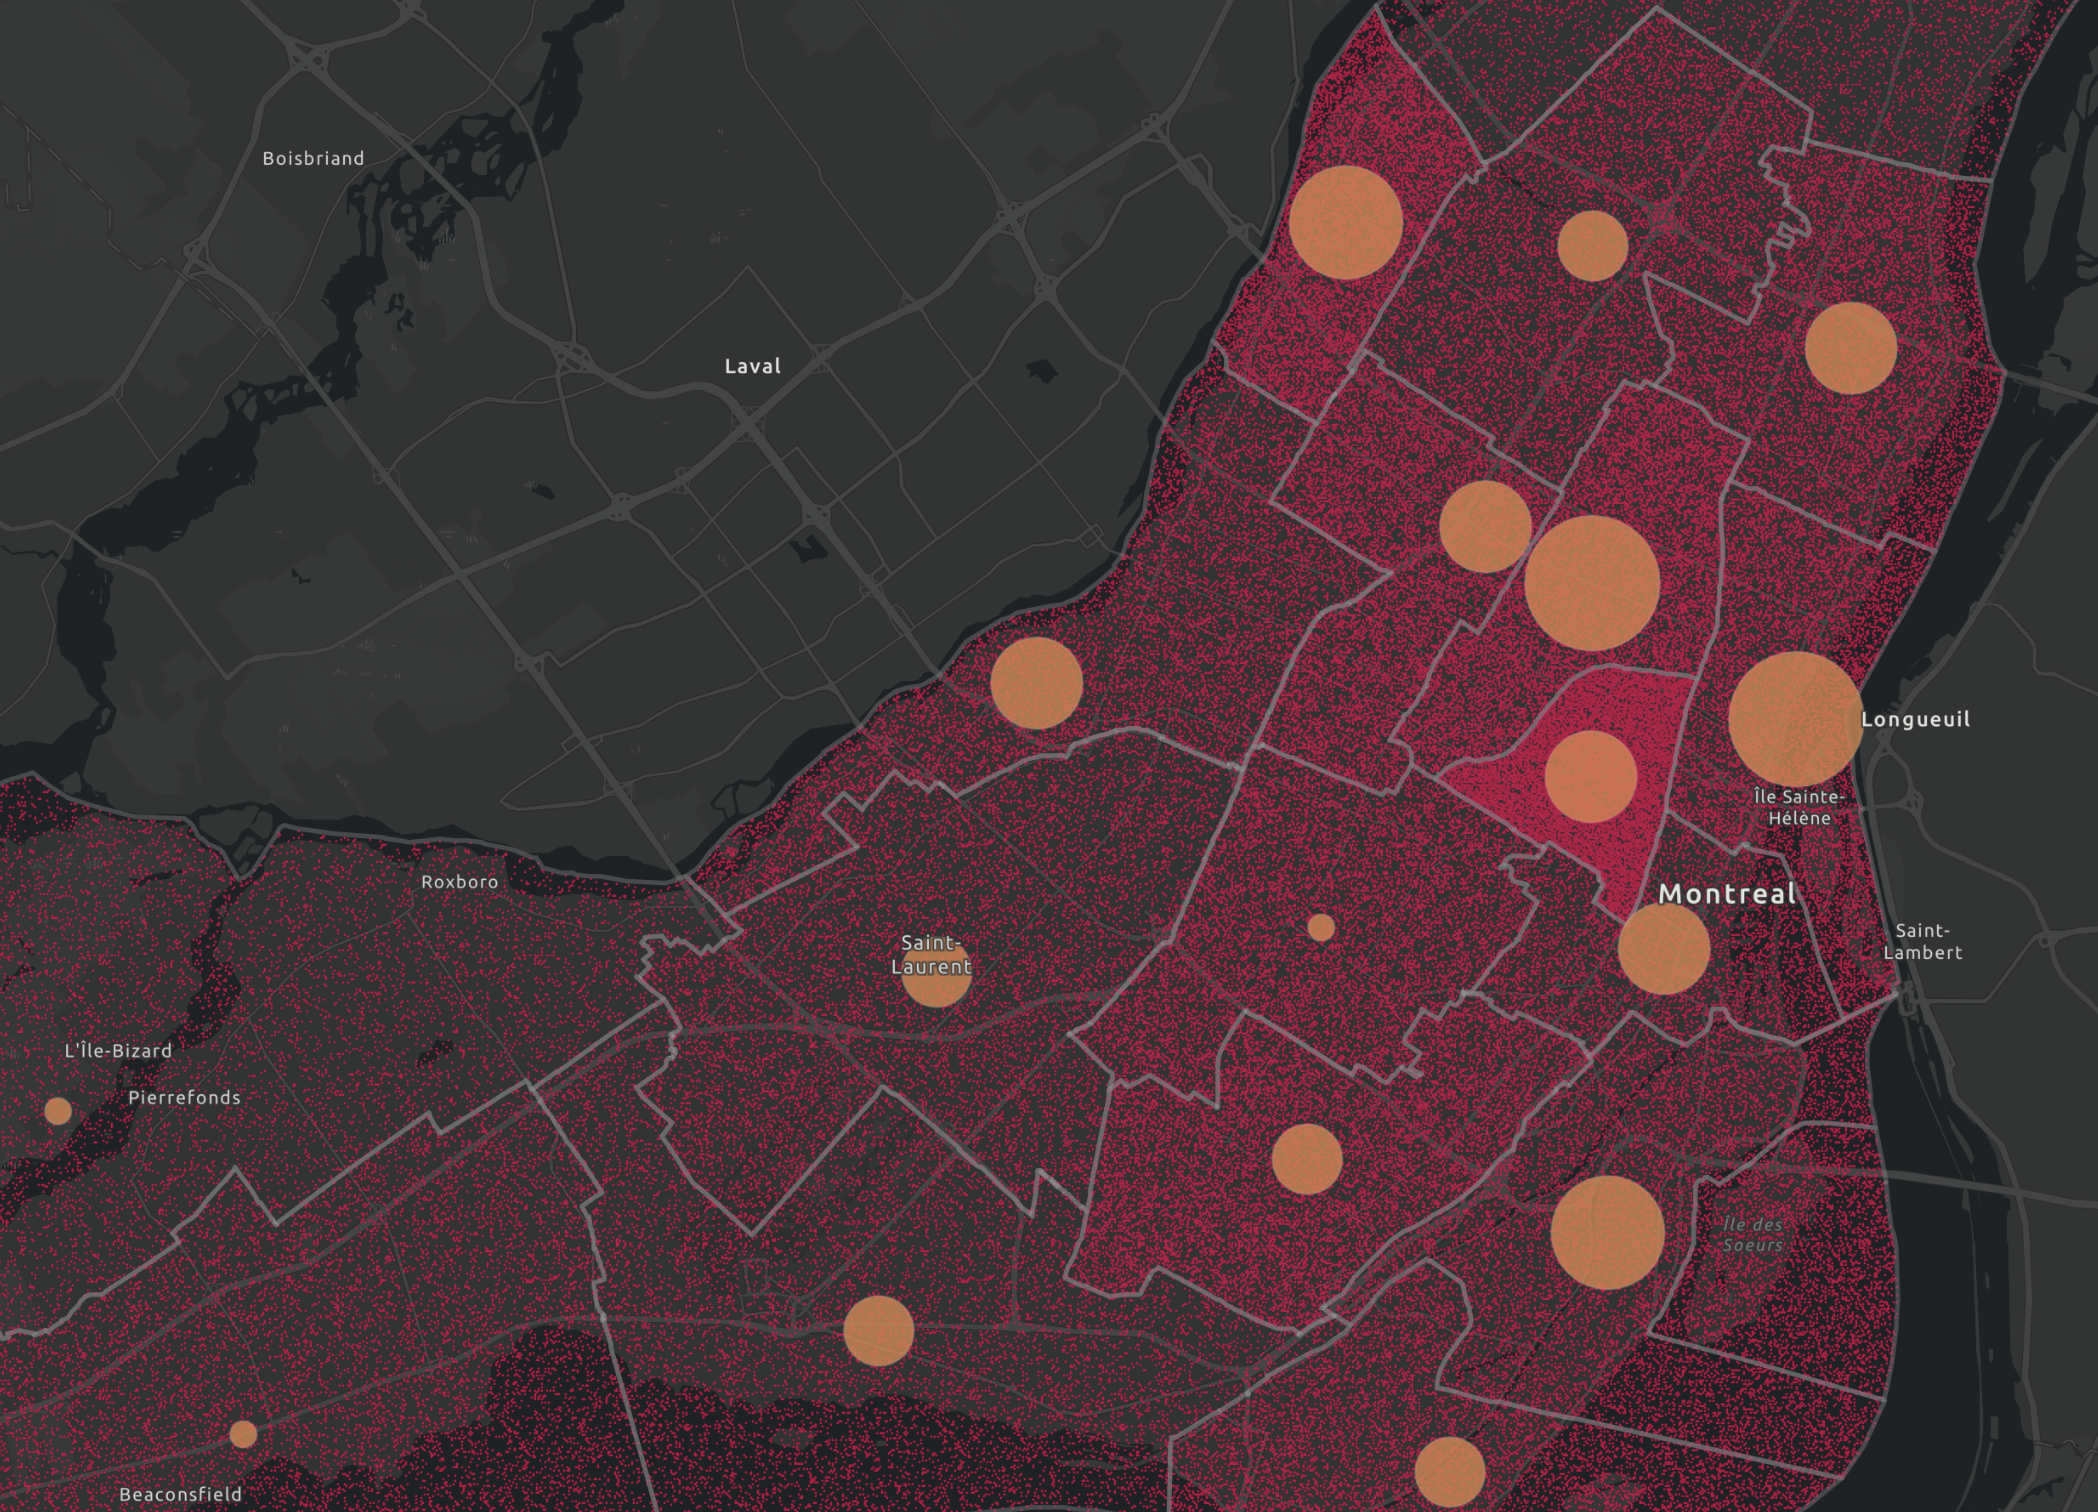
Longitudinal analysis using CMHC data to track rental price growth and affordability patterns across 18 Montréal neighborhoods from 2014-2024. Inflation-adjusted calculations reveal real rent changes and shifting rent burden distributions across the island.
![<subject>[interface] image of hr software in action (for a hr tech)</subject>](https://cdn.prod.website-files.com/690a103420c462c71c28328d/69174796a205089783715377_img3comm.png)
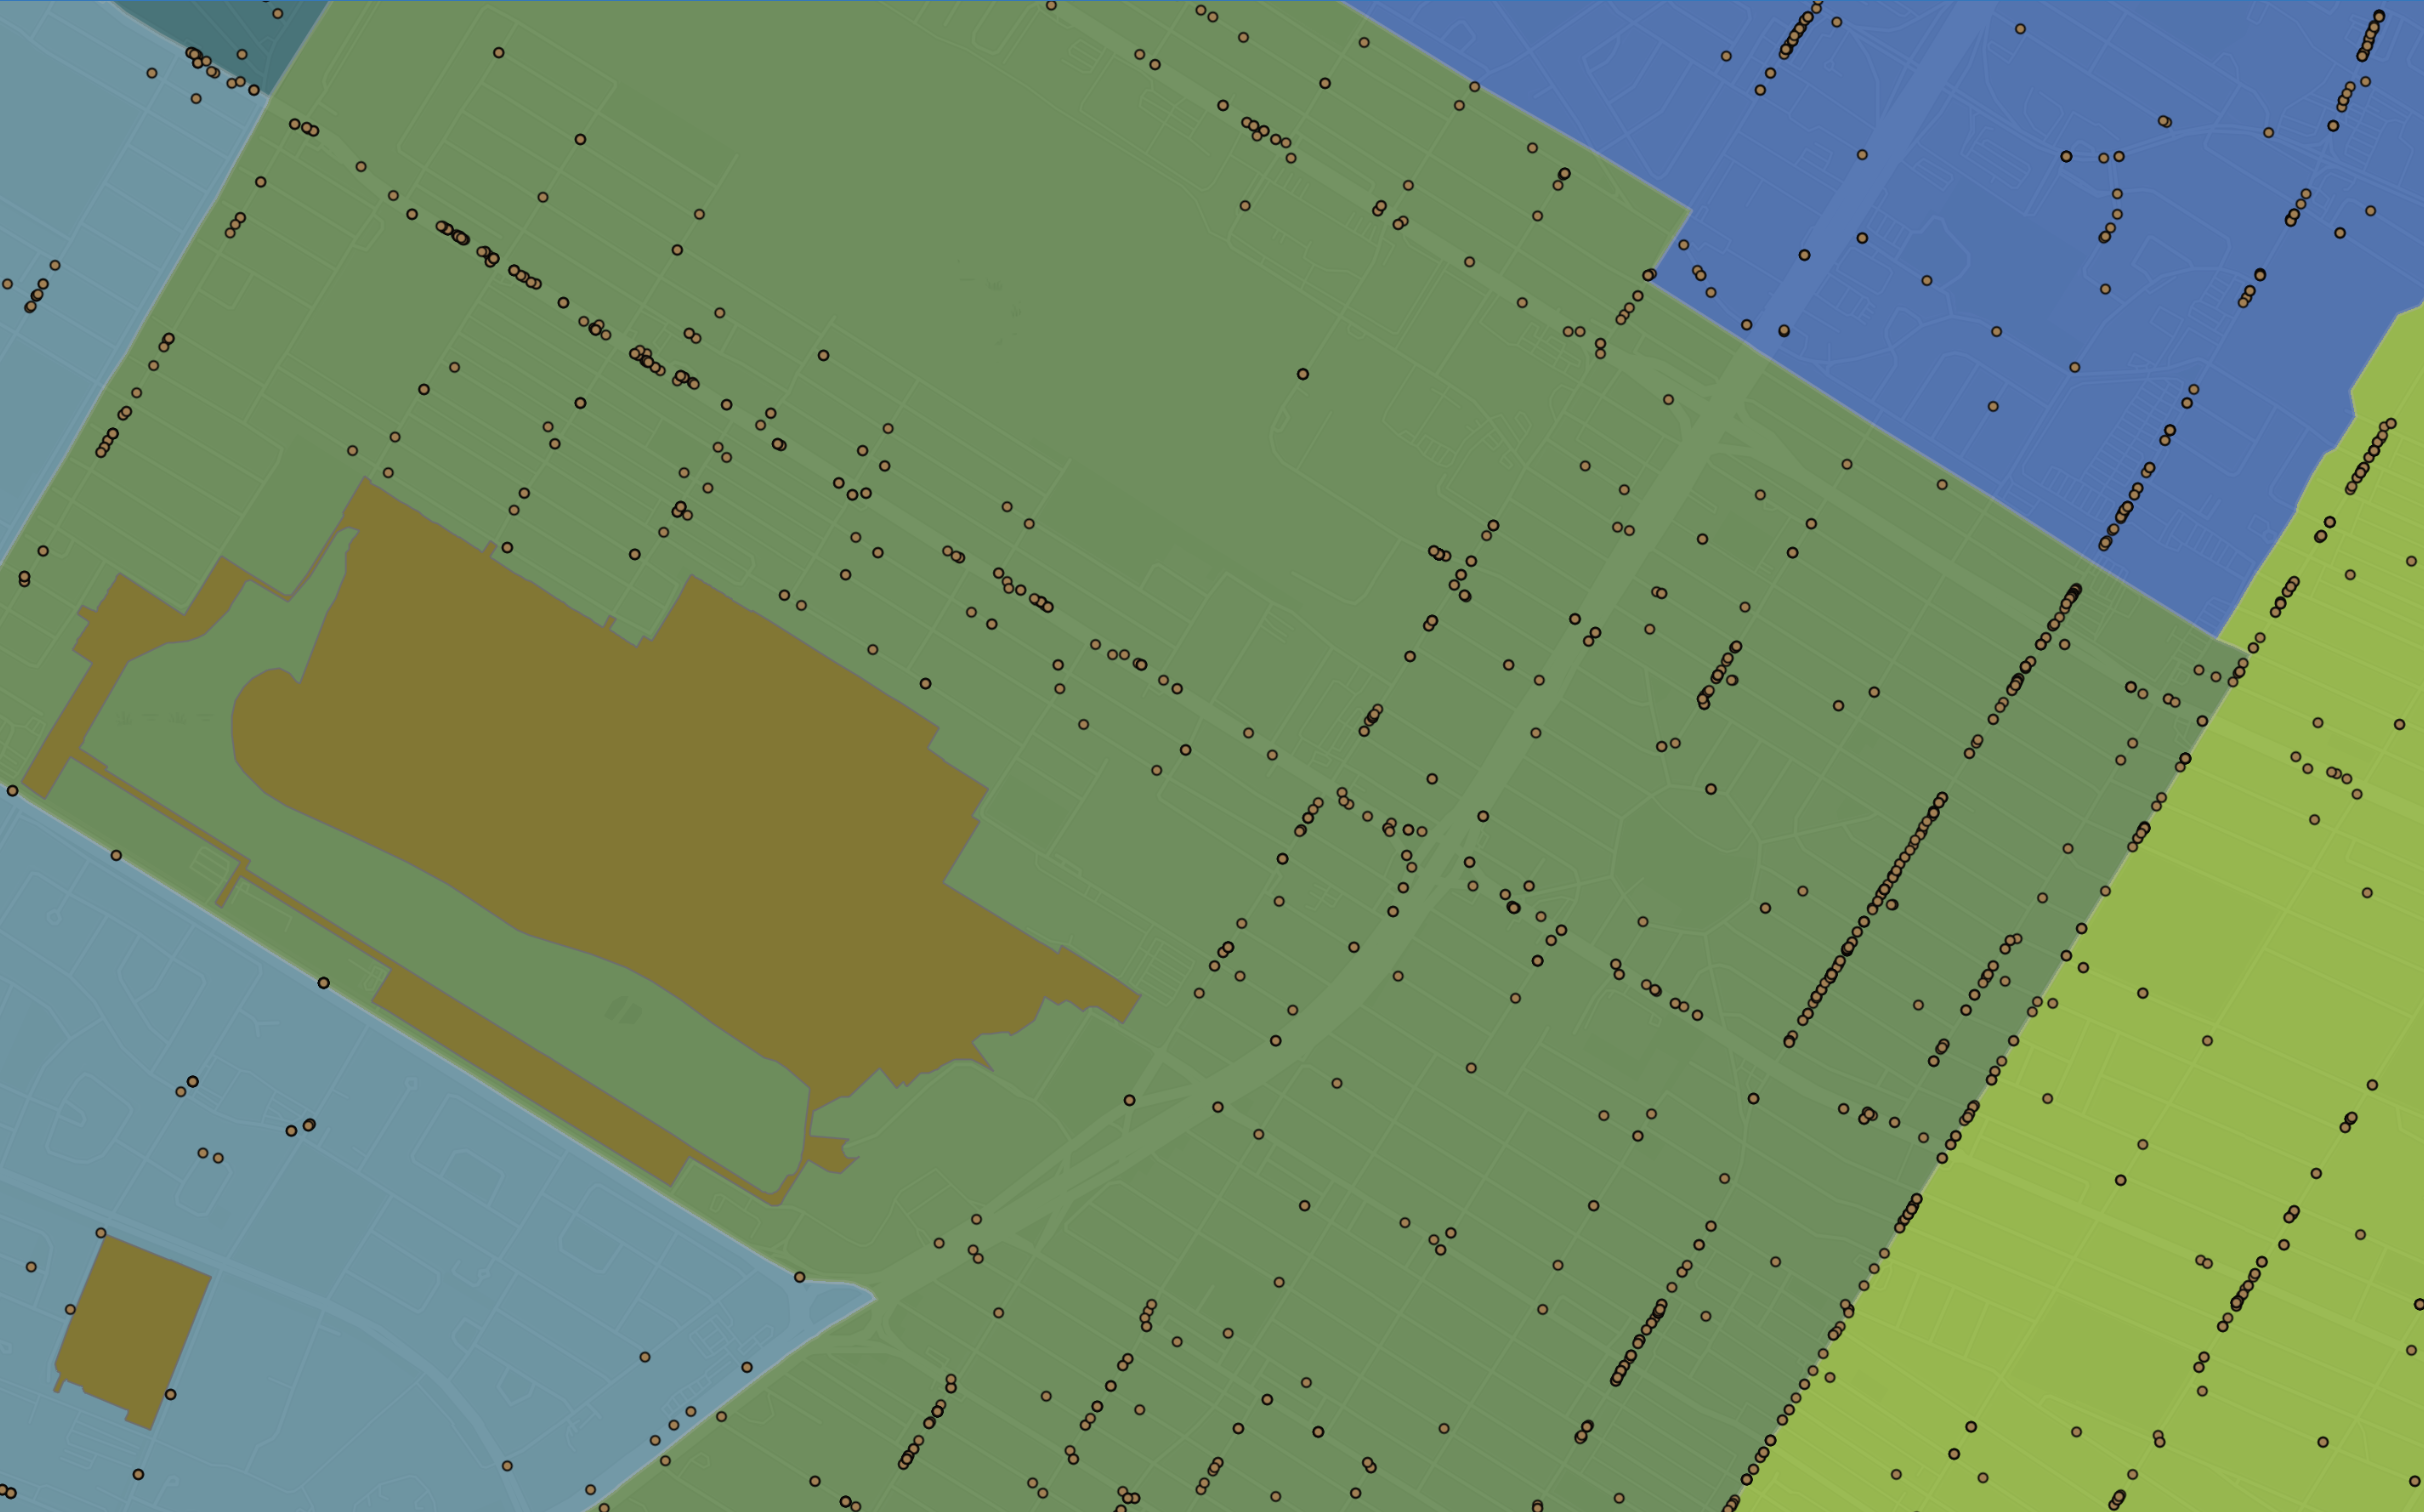
Spatial analysis using demographic projections to calculate transit dependency rates among employed workers by neighborhood. For workforce planning and policy analysis.

Built for a government health department to optimize resource allocation and program targeting. Custom platform synthesizing 70+ socioeconomic, health, and infrastructure variables into weighted neighborhood rankings,
![<subject>[interface] image of software interface (for a edtech)</subject>](https://cdn.prod.website-files.com/690a103420c462c71c28328d/6917499003f4da00843cbd84_food7.png)
Built to support regional food banks. We integrated MRI-Simmons psychographic data and spatial analysis to enable a real time location-based referrals platform via SMS while providing tools to identify service gaps and optimize distribution network planning.

![[background image] of downtown area (for a roofing contractor)](https://cdn.prod.website-files.com/690a103420c462c71c28328d/6914fde3c062a7974606a090_3ec245aa-5352-48bb-af3f-2432338b47da.avif)